Check out our White Paper Series!
A complete library of helpful advice and survival guides for every aspect of system monitoring and control.
1-800-693-0351
Have a specific question? Ask our team of expert engineers and get a specific answer!
Sign up for the next DPS Factory Training!

Whether you're new to our equipment or you've used it for years, DPS factory training is the best way to get more from your monitoring.
Reserve Your Seat TodaySetting up e-mail notifications for the NetGuardian can sometimes be tricky, but the NetGuardian software includes a useful debug utility for diagnosing communications problems. In most cases, you will be able to install a new NetGuardian or add e-mail addresses for new personnel without having to use the debug utility. But if there is a problem, the debug utility is a quick, easy, and extremely powerful way of isolating the problem.
You can view extra communication detail and many other debug options through the TTY interface, which can be accessed through either a Telnet session or through a direct connection to the NetGuardian's craft port.
First, connect to the NetGuardian craft port or establish a Telnet connection. Remember, NetGuardian Telnet sessions are hosted at Port 2002, which should be entered after the NetGuardian's IP address. For example, type "telnet 126.10.230.205 2002" and press Enter.
When a connection is established (this is sometimes indicated by the receipt of a hex byte), type "dpscfg" and press Enter to access the configuration menu.
The password prompt will appear. Enter your password. (The factory default password is "dpstelecom."
Type "D" to select the D)ebug option.
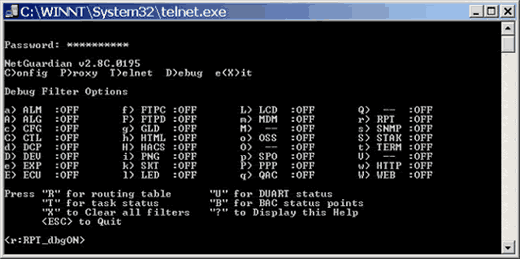
A list of debug filters will be displayed. (See screenshot below.) Each filter isolates different aspects of communications traffic. By default, all filters are off.

Press "r" (note that this is lower-case "r") to activate the reporting filter. A prompt will indicate that the reporting debug filter is on.
Now create an alarm condition to force the NetGuardian to send an e-mail notification. If you are not at the NetGuardian site, follow the steps below to remotely create an alarm.
Make a second connection to the NetGuardian, either through a separate Telnet session or the Web Browser interface.
Open the Alarm Configuration screen. (On the TTY interface, select
C)onfig > E)dit > A)larms. On the Web Browser interface, select Base Alarms from the Edit menu.)
Change the polarity of alarm point. (Make sure you choose an alarm point that is configured to send an e-mail notification.) This will cause the report an alarm without actually causing a physical alarm. (Don't forget to change the polarity back when you're done.)
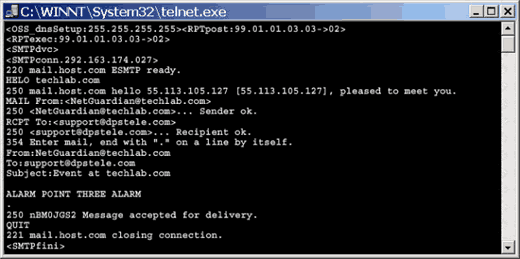
Back in your original Telnet session, where you set the reporting debug filter, you will see the NetGuardian attempt to send the e-mail. Below is the debug information of an e-mail that was successfully sent from the NetGuardian. This shows the communications traffic between the NetGuardian and the e-mail server.

Did we receive any debug? If no, check your alarm point and pager setup.
At the beginning on the debug you should see the posting of the alarm point in the example we have "<RPTpost:99.01.01.03.03->02>"
This will be follow by the email server IP address "<SMTPconn.292.163.174.027>". Does this match the email server IP address that you databased in the NetGuardian?
The NetGuardian will receive a greeting from the email server (e.g."HELO techlab.com"). If you do not receive a greeting from the server, you should verify the e-mail server IP address with your MIS group.
You will then see who the email is from and who it will be set to. Verify the two fields.
Finally, did the email server accept the message? (e.g. "250 nBM0JGS2 Message accepted for delivery. QUIT").
If checking the debug information does not reveal the communication problem call DPS Telecom Technical Support, or e-mail us. You'll be connected directly to an expert support technician, not stuck in an endless voice-mail-loop hell. We'll help you get your critical network monitoring system online and we'll make sure it stays that way.
Are you having technical issues and need support?
Give us a call and talk to one of our tech support specialists. They'll help answer any questions you may have.
Tech Support: 559-454-1600 • Fax: 559-454-1688